Marking carbon's card
- Alessandro Vitelli

- Apr 29, 2020
- 6 min read
Hard as though it may be to believe, EU carbon prices are down by just 17.5% since the start of the year. In comparison, TTF year-ahead gas is off 25%, while year-ahead German baseload power and API2 coal are both down by 16%. And the rolling front-month Brent crude contract is a whopping 70% down since January 1.
But why *should* carbon be lower than it is? Shouldn’t it be in line with power and gas, since they’re the relevant inputs for emissions pricing at the moment, aren’t they?
Well, yes and no.
1. If we consider carbon market supply holistically, there are enough EUAs already in circulation today to meet all of 2020’s compliance demand, and probably a healthy slice of 2021’s demand as well.

There’ll be next to no demand at the moment for EUAs from industrial sectors that have been closed for six weeks, and remember industrial output was already beginning to shrink even before the coronavirus lockdowns began. So those free allocations of EUAs may end up being sufficient to cover almost all industrial needs for 2020.
2. Power demand across the EU fell by 10% between March 10 and April 10 compared to a year earlier, according to the Wartsila Energy Transition Lab. Emissions intensity of power generation declined by nearly 20%, due in large part to a drop of 25% in coal-fired power over the first quarter.
So a 10% drop in power demand was met with a 20% drop in power’s CO2 intensity. Bad news for carbon, since utilities are going to need to buy fewer EUAs in the auctions or the secondary market if more of the demand for electricity during lockdown is being met by renewables and gas.
3. And this is partly borne out in auction data: the trend in auction cover ratios is still declining steadily, and we’ve noticed lately that auction administrators seem to be allowing a little more latitude when it comes to just how far from secondary market prices the clearing price can stray.

4. This week also sees the end of the annual compliance season. In fact, Tuesday was the last day to buy spot EUAs in time to get them into compliance accounts before the Tuesday deadline. So industrial demand to cover 2019 emissions is now over. Bad news #2 for carbon.
5. Fuel prices are also looking grim. Delivered coal prices into Rotterdam have fallen to around $40/tonne according to the globalCOAL daily index, the lowest since at least 2013.

At the same time, natural gas prices are also at record lows, so there is no real shift in the merit order as a result. The respective prices of carbon, gas, coal and power today mean that even the most efficient coal plant isn’t making more money than gas.
Last year a lot of traders and analysts expected to see fuel switching reach its maximum potential this year, and it looks like they were right. I'll revisit this later.
6. Next, we have to address the now-standard expectation that the Market Stability Reserve will help to slowly drain the surplus out of the market.
7. The 8.9% drop in 2019 emissions (around 150m tonnes) would normally mean that the MSR would be burdened with absorbing that lost demand before it can even start eating into the historical surplus.
8. But because the UK didn’t issue or sell any EUAs in 2019, the overall market supply will be some 160m tonnes less than expected for 2019, which balances out the lower emissions. So MSR will indeed eat away at some of the oversupply when it starts its annual withdrawal from September this year.
9. That’s all well and good for 2019, but when the time comes to calculate the market supply for 2020, there will be two years’ worth of UK supply to contend with – let’s call that a round 300m tonnes for convenience. That’s because the UK is issuing and selling EUAs for both 2019 and 2020 this year.
10. Add to that the loss of demand due to the pandemic – which could be anything from 100m to 400m tonnes according to various analysts – and suddenly the total additional supply in the market this year may end up being as much as 700m tonnes!
11. Technical indicators are also looking a bit gloomy.
Firstly, open interest in the benchmark December 2020 contract is shrinking, at a time when it is normally increasing. Dec-20 open interest is down 1.7% since March 5, when the coronavirus sell-off started. Dec-21 OI, on the other hand, is up nearly 45%. (To be exact, Dec 20 OI peaked on April 1 at 431 million tonnes and has fallen nearly 5% since then.)

12. Could it be that compliance entities (including utilities) have already given up on 2020 and decided to start shifting their exposure to 2021? That doesn’t feel healthy. However, it is leaving the field open to speculators, especially short-term traders, who are enjoying some of the highest volatility we’ve seen for some time.
13. Since April 6 EUA prices have been largely contained between two simple moving averages, the 50-day and 20-day. Those two lines are converging – Tuesday’s €0.82 difference between the two encapsulated pretty much the whole day’s trading. One of these moving averages will be breached before long.
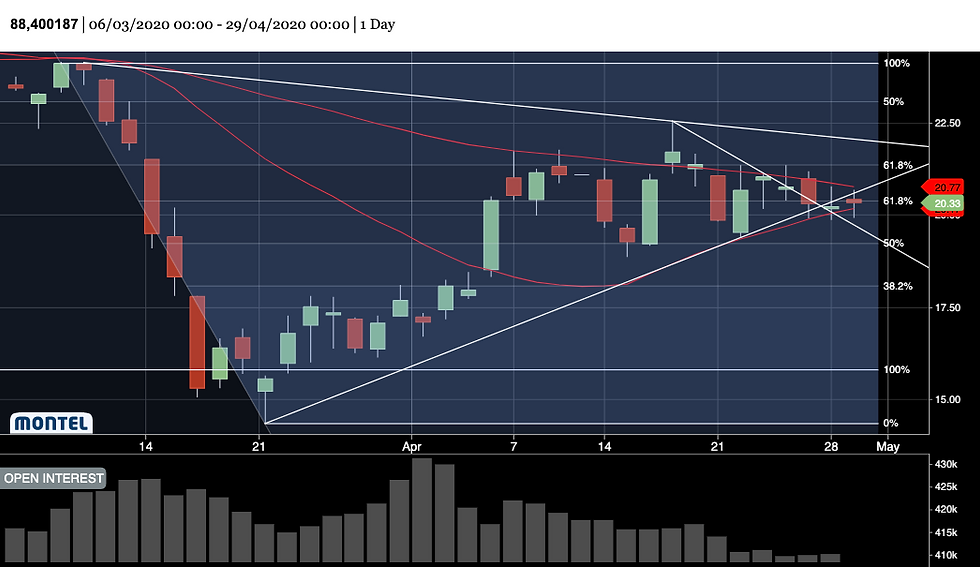
14. For the last two weeks EUA prices have been capped by a fairly steep descending trend-line. While Tuesday’s close did manage to clear this line, it wasn’t by much. This descending trend-line intersected with a rising trend-line yesterday, and this upward line may now act as a resistance for carbon.
15. The Bollinger bands, too, are finally beginning to narrow in a way that suggests we may be approaching a breakout. While the bands are still nowhere near as narrow as they have been in previous months, they’re at least starting to look interesting again.

All in all, there’s not a lot of joy in the fundamental or technical pictures. And to this we can add one new political input as well: the Netherlands’ government is planning how to reduce operations or close three of its five remaining coal plants in order to comply with a Supreme Court ruling.
But, let’s shake off the despondency and look at the bright side.
16. Firstly, France’s EDF has cut its nuclear output target for the year from 375-390 TWh to 300 TWh, with around 40-45% of its total capacity off-line for maintenance in the third quarter. Replacing that lost supply is expected to lead to increased fossil generation and additional imports from fossil-based countries. Hello, increased carbon demand.
17. Depending on the speed with which coronavirus lockdowns and closures are lifted, Europe could start building back up towards normal demand over the second half of the year, which would boost demand for power as well as energy intensive products.
18. Looking back at point 5 above, if we can agree that fuel-switching is more or less exhausted now, it means that we won't see much more, if any, loss of demand due to shifting power generation from coal to gas. That's not an exact positive, but more of a non-negative factor.
19. Let’s also not forget that Phase 4 begins next year, and with that comes a significant tightening to the free allocation regime. The linear reduction factor – the annual cut in the overall cap – decreases by 2.2% a year instead of 1.74%/year – and free allocations to industry will continue to shrink. This means potentially more demand for EUAs from the market.
20. We also have political uncertainties on two fronts to contend with. Firstly, the proposal to tighten the EU’s overall 2030 emissions target to 50 or 55% below 1990 levels, compared with the original 40% goal. Most recently, Germany’s chancellor Merkel has come out in support of the move, though Jutte Gyteland, the MEP in charge of the EU ETS brief in the European Parliament, has suggested a 65% reduction goal could be set.
Any amendment to the target would require alterations to the EU ETS trajectory, so there is still some work to be done to finalise the rules for the phase that starts in just eight months!
21. Beyond 2030 lies the EU Green Deal and the 2050 net-zero target. This entire proposal needs to be negotiated over the next two years, and the talks will encompass a review of the EU ETS as well as of the MSR. Certainly the steadily increasing ambition both for 2030 as well as 2050 may require the MSR to do more heavier lifting for longer, and 24% until 2023 doesn’t look very helpful any more.
It’s significant that the bearish price influences all seem to be short-term elements, while the optimistic factors are all rather longer-term. This view is shared by many in the market.
While EUA prices don’t presently reflect the sort of short-term bearishness that people are feeling, there’s still time for the market to price in a shocking drop in demand in 2020 and a slow recovery over the next two years, before the EU embarks on the long-term programme of ambitious reforms.


Comments